ಪರಿಶೀಲಿಸಿ ಮತ್ತು ಪ್ರೊಫೈಲ್ ಅನ್ನು ನವೀಕರಿಸಿ
ಹಕ್ಕು ಸಾಧಿಸಿದ ಪ್ರೊಫೈಲ್ಗಳು ಹುಡುಕಾಟ ಫಲಿತಾಂಶಗಳ ಮೇಲ್ಭಾಗಕ್ಕೆ ಹೋಗುತ್ತವೆ. ಈಗಲೇ ಪರಿಶೀಲಿಸಿ, ಇದು ಕೇವಲ ಒಂದೆರಡು ನಿಮಿಷಗಳನ್ನು ತೆಗೆದುಕೊಳ್ಳುತ್ತದೆ.
ಭೇಟಿ ನೀಡಿ
ವರದಿ
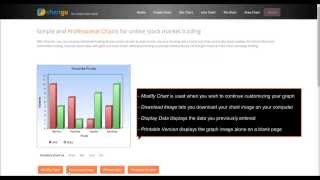
This online tool facilitates the creation of various types of charts, including bar, line, pie, and area charts, allowing users to visualize data effectively and attractively. Features such as easy data import, extensive customization options, and no associated costs, it addresses the needs of data professionals, educators, and anyone seeking to present information clearly and engagingly.
ChartGo ಅನ್ನು ಇಲ್ಲಿ ಕಾಣಬಹುದು Data Analysis & Visualization Software ವಿಭಾಗಗಳು.
ChartGo ಗೆ ಹೋಲುವ ಉತ್ಪನ್ನಗಳು:
ಸ್ಕ್ರೀನ್ಶಾಟ್ಗಳು
ಇನ್ನೂ ಯಾವುದೇ ಸ್ಕ್ರೀನ್ಶಾಟ್ಗಳನ್ನು ಅಪ್ಲೋಡ್ ಮಾಡಿಲ್ಲ. ನೀವು ಈ ವ್ಯವಹಾರದ ಮಾಲೀಕರೇ?
ಸ್ಕ್ರೀನ್ಶಾಟ್ಗಳನ್ನು ಅಪ್ಲೋಡ್ ಮಾಡಿ.YouTube ವೀಡಿಯೊಗಳು
ಅಧಿಕೃತ YouTube ಚಾನಲ್ನಿಂದ ವೀಡಿಯೊಗಳು
(12 videos)


ವಿವರಗಳು
ChartGo ಮುಖ್ಯ ವೈಶಿಷ್ಟ್ಯಗಳು
ChartGo ಪ್ರಯೋಜನಗಳು
ChartGo ಅನ್ನು ಯಾರು ಬಳಸಬೇಕು?
ಬ್ಯಾಡ್ಜ್ಗಳು
ನಮ್ಮ ಬ್ಯಾಡ್ಜ್ಗಳಲ್ಲಿ ಒಂದರೊಂದಿಗೆ ನಿಮ್ಮ SaaS ಅಧಿಕಾರವನ್ನು ಹೆಚ್ಚಿಸಿ
ChartGo ಪರ್ಯಾಯಗಳು
DashThis ಬಡ್ತಿ ನೀಡಲಾಗಿದೆ
DashThis is an automated marketing reporting tool designed to help users crea...
Graph Maker
A versatile online tool enables users to create a wide variety of charts and ...
ChartMaker
This browser-based charting platform converts data into professional visuals ...
Nderim
This tool enables users to effortlessly create visually appealing, hand-drawn...
Graph Plotter
ಪರಿಶೀಲಿತ ಪ್ರೊಫೈಲ್
A data visualization and graph plotting tool enables users to easily create a...
ಈ ವರ್ಗದಲ್ಲಿ ಇನ್ನಷ್ಟು ಅನ್ವೇಷಿಸಿ:
ಬಳಸಿದ ತಂತ್ರಜ್ಞಾನಗಳು
ಎಲ್ಲಾ ತಂತ್ರಜ್ಞಾನಗಳನ್ನು ವೀಕ್ಷಿಸಿ
* ಅಸುರಕ್ಷಿತ ವೆಬ್ ಸಂಪನ್ಮೂಲಗಳ ಕುರಿತು ನಿಖರವಾದ, ನವೀಕೃತ ಮಾಹಿತಿಯನ್ನು ಒದಗಿಸಲು Google ಶ್ರಮಿಸುತ್ತದೆ ಆದರೆ ಸಂಪೂರ್ಣತೆ ಅಥವಾ ದೋಷ-ಮುಕ್ತ ಫಲಿತಾಂಶಗಳನ್ನು ಖಾತರಿಪಡಿಸುವುದಿಲ್ಲ.
** ಈ ಪುಟದ ಕೆಲವು ಅಥವಾ ಎಲ್ಲಾ ಭಾಗಗಳು AI ನಿಂದ ರಚಿತವಾಗಿರಬಹುದು, ಆದ್ದರಿಂದ ದಯವಿಟ್ಟು ಯಾವುದೇ ನಿರ್ಣಾಯಕ ಮಾಹಿತಿಯನ್ನು ಸ್ವತಂತ್ರವಾಗಿ ಪರಿಶೀಲಿಸಿ.
ಇತ್ತೀಚೆಗೆ ಹಕ್ಕು ಪಡೆಯಲಾಗಿದೆ
ಇ-ಸರ್ಕಾರ ಮತ್ತು ಡಿಜಿಟಲ್ ರೂಪಾಂತರ ವೇದಿಕೆಗಳು
ಪ್ರಭಾವಿ ಮಾರ್ಕೆಟಿಂಗ್ & ಔಟ್ರೀಚ್ ಪರಿಕರಗಳು
ಉದ್ಯೋಗಿ ಮಾನಿಟರಿಂಗ್ ಸಾಫ್ಟ್ವೇರ್
ಗ್ರಾಹಕರ ಪ್ರತಿಕ್ರಿಯೆ ಮತ್ತು ಸಮೀಕ್ಷೆ ಸಾಫ್ಟ್ವೇರ್
ಡೇಟಾ ವಿಶ್ಲೇಷಣೆ ಮತ್ತು ದೃಶ್ಯೀಕರಣ ಸಾಫ್ಟ್ವೇರ್
ಇಮೇಲ್ ಔಟ್ರೀಚ್ ಮತ್ತು ಕೋಲ್ಡ್ ಇಮೇಲ್ ಪರಿಕರಗಳು
ಸಮಯ ಟ್ರ್ಯಾಕಿಂಗ್ & ಉತ್ಪಾದಕತಾ ಸಾಫ್ಟ್ವೇರ್
ಸಮಯ ಟ್ರ್ಯಾಕಿಂಗ್ & ಉತ್ಪಾದಕತಾ ಸಾಫ್ಟ್ವೇರ್
ಸಾರ್ವಜನಿಕ ಸುರಕ್ಷತೆ ಮತ್ತು ತುರ್ತುಸ್ಥಿತಿ ನಿರ್ವಹಣಾ ಸಾಫ್ಟ್ವೇರ್
ಡೇಟಾ ವಿಶ್ಲೇಷಣೆ ಮತ್ತು ದೃಶ್ಯೀಕರಣ ಸಾಫ್ಟ್ವೇರ್
ಇತ್ತೀಚೆಗೆ ಸೇರಿಸಲಾಗಿದೆ
INI Monitor
ವೆಬ್ಸೈಟ್ ಮಾನಿಟರಿಂಗ್, ಅಪ್ಟೈಮ್ ಮತ್ತು ಕಾರ್ಯಕ್ಷಮತೆ
VEP
ವರ್ಕ್ಫ್ಲೋ ಆಟೊಮೇಷನ್ ಮತ್ತು RPA
CandivateATS
ಅರ್ಜಿದಾರರ ಟ್ರ್ಯಾಕಿಂಗ್ ವ್ಯವಸ್ಥೆಗಳು (ATS)
Overtime
ಮಾರ್ಕೆಟಿಂಗ್ ಆಟೊಮೇಷನ್ ಪ್ಲಾಟ್ಫಾರ್ಮ್ಗಳು
Level Up College Recruiting
AI-ಚಾಲಿತ ರೆಸ್ಯೂಮ್ ಸ್ಕ್ರೀನಿಂಗ್ ಪರಿಕರಗಳು
Cubewise
ಹಣಕಾಸು ಯೋಜನೆ ಮತ್ತು ವಿಶ್ಲೇಷಣೆ (FP&A)
Lynkha
ಲ್ಯಾಂಡಿಂಗ್ ಪೇಜ್ ಬಿಲ್ಡರ್ಗಳು ಮತ್ತು ಲೀಡ್ ಮ್ಯಾಗ್ನೆಟ್ಗಳು
TaskAcross
ಕಾರ್ಯ ನಿರ್ವಹಣೆ ಮತ್ತು ಮಾಡಬೇಕಾದ ಪಟ್ಟಿ ಅಪ್ಲಿಕೇಶನ್ಗಳು
SentinelAI
ಸಾಮೂಹಿಕ ಗುಪ್ತಚರ ವೇದಿಕೆ
ConservPro
ಜಾನುವಾರು ನಿರ್ವಹಣಾ ಸಾಫ್ಟ್ವೇರ್
ಈ ತಿಂಗಳ ಟಾಪ್ 10 ವರ್ಗಗಳು
1.
ಮಾರಾಟ ಯಾಂತ್ರೀಕೃತ ಸಾಫ್ಟ್ವೇರ್
+856
ಕಳೆದ 30 ದಿನಗಳಲ್ಲಿ ಈ ವರ್ಗಕ್ಕೆ ಸೇರಿಸಲಾದ ಹೊಸ SaaS ಉತ್ಪನ್ನಗಳ ಸಂಖ್ಯೆ.
2.
ಬ್ಲಾಕ್ಚೈನ್ ಮತ್ತು NFT ನಿರ್ವಹಣಾ ವೇದಿಕೆಗಳು
+592
ಕಳೆದ 30 ದಿನಗಳಲ್ಲಿ ಈ ವರ್ಗಕ್ಕೆ ಸೇರಿಸಲಾದ ಹೊಸ SaaS ಉತ್ಪನ್ನಗಳ ಸಂಖ್ಯೆ.
3.
ಡಾಕ್ಯುಮೆಂಟ್ ನಿರ್ವಹಣೆ ಮತ್ತು ಇ-ಸಹಿ ಪರಿಕರಗಳು
+522
ಕಳೆದ 30 ದಿನಗಳಲ್ಲಿ ಈ ವರ್ಗಕ್ಕೆ ಸೇರಿಸಲಾದ ಹೊಸ SaaS ಉತ್ಪನ್ನಗಳ ಸಂಖ್ಯೆ.
4.
AI-ಚಾಲಿತ ವರ್ಚುವಲ್ ಅವತಾರ್ಗಳು ಮತ್ತು ಡಿಜಿಟಲ್ ಸಹಾಯಕರು
+497
ಕಳೆದ 30 ದಿನಗಳಲ್ಲಿ ಈ ವರ್ಗಕ್ಕೆ ಸೇರಿಸಲಾದ ಹೊಸ SaaS ಉತ್ಪನ್ನಗಳ ಸಂಖ್ಯೆ.
5.
ಮೇಘ ಭದ್ರತೆ ಮತ್ತು ಅನುಸರಣೆ ಪರಿಕರಗಳು
+493
ಕಳೆದ 30 ದಿನಗಳಲ್ಲಿ ಈ ವರ್ಗಕ್ಕೆ ಸೇರಿಸಲಾದ ಹೊಸ SaaS ಉತ್ಪನ್ನಗಳ ಸಂಖ್ಯೆ.
6.
AI-ಚಾಲಿತ ರೆಸ್ಯೂಮ್ ಸ್ಕ್ರೀನಿಂಗ್ ಪರಿಕರಗಳು
+489
ಕಳೆದ 30 ದಿನಗಳಲ್ಲಿ ಈ ವರ್ಗಕ್ಕೆ ಸೇರಿಸಲಾದ ಹೊಸ SaaS ಉತ್ಪನ್ನಗಳ ಸಂಖ್ಯೆ.
7.
AI-ಚಾಲಿತ ರೋಗನಿರ್ಣಯ ಮತ್ತು ಆರೋಗ್ಯ ವಿಶ್ಲೇಷಣೆ
+445
ಕಳೆದ 30 ದಿನಗಳಲ್ಲಿ ಈ ವರ್ಗಕ್ಕೆ ಸೇರಿಸಲಾದ ಹೊಸ SaaS ಉತ್ಪನ್ನಗಳ ಸಂಖ್ಯೆ.
8.
AI-ಚಾಲಿತ ಕಾನೂನು ಸಂಶೋಧನಾ ವೇದಿಕೆಗಳು
+433
ಕಳೆದ 30 ದಿನಗಳಲ್ಲಿ ಈ ವರ್ಗಕ್ಕೆ ಸೇರಿಸಲಾದ ಹೊಸ SaaS ಉತ್ಪನ್ನಗಳ ಸಂಖ್ಯೆ.
9.
ಕಲಿಕೆ ಮತ್ತು ಶಿಕ್ಷಣ ವೇದಿಕೆಗಳು
+426
ಕಳೆದ 30 ದಿನಗಳಲ್ಲಿ ಈ ವರ್ಗಕ್ಕೆ ಸೇರಿಸಲಾದ ಹೊಸ SaaS ಉತ್ಪನ್ನಗಳ ಸಂಖ್ಯೆ.
10.
ಫ್ಲೀಟ್ ಮ್ಯಾನೇಜ್ಮೆಂಟ್ ಸಾಫ್ಟ್ವೇರ್
+422
ಕಳೆದ 30 ದಿನಗಳಲ್ಲಿ ಈ ವರ್ಗಕ್ಕೆ ಸೇರಿಸಲಾದ ಹೊಸ SaaS ಉತ್ಪನ್ನಗಳ ಸಂಖ್ಯೆ.
SaaS ಬ್ರೌಸರ್ ಅಂಕಿಅಂಶಗಳು
ಕಳೆದ 30 ದಿನಗಳನ್ನು ಸೇರಿಸಲಾಗಿದೆ
+21,811
ಕಳೆದ 30 ದಿನಗಳಲ್ಲಿ ನಮ್ಮ ಡೇಟಾಬೇಸ್ಗೆ ಪತ್ತೆಯಾದ ಮತ್ತು ಸೇರಿಸಲಾದ ಹೊಸ SaaS ಉತ್ಪನ್ನಗಳ ಸಂಖ್ಯೆ.
ಸಕ್ರಿಯ SaaS
468,001
ನಮ್ಮ ಸರ್ಚ್ ಇಂಜಿನ್ನಲ್ಲಿ ಪ್ರಸ್ತುತ ಸೂಚ್ಯಂಕದಲ್ಲಿರುವ ಪ್ರಕಟಿತ ಮತ್ತು ಸಕ್ರಿಯ SaaS ಉತ್ಪನ್ನಗಳ ಒಟ್ಟು ಸಂಖ್ಯೆ.
ಡೇಟಾಬೇಸ್ನಲ್ಲಿ ಒಟ್ಟು
1,296,182
ಅಪ್ರಕಟಿತ ಮತ್ತು ನಿಲ್ಲಿಸಲಾದ ನಮೂದುಗಳನ್ನು ಒಳಗೊಂಡಂತೆ ನಮ್ಮ ಡೇಟಾಬೇಸ್ನಲ್ಲಿರುವ ಎಲ್ಲಾ SaaS ಉತ್ಪನ್ನಗಳ ಒಟ್ಟು ಸಂಖ್ಯೆ.
SaaS ಬ್ರೌಸರ್ಗೆ ಉಚಿತವಾಗಿ ಸೇರಿ
ಎಲ್ಲಾ ಸುಧಾರಿತ ಫಿಲ್ಟರ್ಗಳನ್ನು ಉಚಿತವಾಗಿ ಬಳಸಿ.
ನಿಮ್ಮ SaaS ಪಟ್ಟಿಗಳನ್ನು ನಿರ್ವಹಿಸಿ
ಹೊಸ SaaS ಗಾಗಿ ಉಚಿತ ಎಚ್ಚರಿಕೆಗಳನ್ನು ರಚಿಸಿ
ಪ್ರಾಯೋಜಿತ
Crocoblock
ವರ್ಡ್ಪ್ರೆಸ್ ಪ್ಲಗಿನ್ಗಳು
Usermaven
ವೆಬ್ಸೈಟ್ ಹೀಟ್ಮ್ಯಾಪ್ಗಳು ಮತ್ತು ಬಳಕೆದಾರ ಅನುಭವ ವಿಶ್ಲೇಷಣೆ
Snaptually
AI-ಚಾಲಿತ ವರ್ಚುವಲ್ ಅವತಾರ್ಗಳು ಮತ್ತು ಡಿಜಿಟಲ್ ಸಹಾಯಕರು
Uxcel
ಪ್ರಮಾಣೀಕರಣ, ಪರೀಕ್ಷೆ ಮತ್ತು ಮೌಲ್ಯಮಾಪನ ತಯಾರಿ
Singing Carrots
AI-ಚಾಲಿತ ಭಾಷಾ ಕಲಿಕೆ ಅಪ್ಲಿಕೇಶನ್ಗಳು
FullEnrich
ಲೀಡ್ ಜನರೇಷನ್ ಸಾಫ್ಟ್ವೇರ್
Diginius
ಮಾರ್ಕೆಟಿಂಗ್ ಆಟೊಮೇಷನ್ ಪ್ಲಾಟ್ಫಾರ್ಮ್ಗಳು
Tagshop
AI-ಚಾಲಿತ ಜಾಹೀರಾತು ಸೃಜನಾತ್ಮಕತೆಗಳು ಮತ್ತು ವೀಡಿಯೊ ಉತ್ಪಾದನೆ
Smodin
AI-ಚಾಲಿತ ಬರವಣಿಗೆ ಮತ್ತು ನಕಲು ಉತ್ಪಾದನೆ
LowFruits
SEO ಪರಿಕರಗಳು
ತಪ್ಪಿಸಿಕೊಳ್ಳಬೇಡಿ, ಮೊದಲು ತಿಳಿದುಕೊಳ್ಳಿ!
ಹೊಸ SaaS ಉತ್ಪನ್ನಗಳು ಪ್ರತಿದಿನ ಬಿಡುಗಡೆಯಾಗುತ್ತಿವೆ, ಕಳೆದ 30 ದಿನಗಳಲ್ಲಿ 21,811 ಸೇರಿಸಲಾಗಿದೆ. ಮಾಹಿತಿ ಪಡೆದುಕೊಳ್ಳಿ ಮತ್ತು ನಿಮ್ಮ ಹುಡುಕಾಟ ಪ್ರಶ್ನೆಗೆ ಹೊಂದಿಕೆಯಾಗುವ ಹೊಸ SaaS ಅನ್ನು SaaS ಬ್ರೌಸರ್ ಕಂಡುಹಿಡಿದಾಗ ಮೊದಲು ತಿಳಿದುಕೊಳ್ಳಿ.
ನಿಮ್ಮ ಹುಡುಕಾಟಕ್ಕೆ ಹೊಂದಿಕೆಯಾಗುವ ಹೊಸ SaaS ಗಾಗಿ ಇಮೇಲ್ ಎಚ್ಚರಿಕೆಗಳನ್ನು ಹೊಂದಿಸಲು ಸೈನ್ ಇನ್ ಮಾಡಿ.
ಎಚ್ಚರಿಕೆ ರಚಿಸಲು ಸೈನ್ ಇನ್ ಮಾಡಿ
ಇದೇ ರೀತಿಯ ಪರಿಕರಗಳನ್ನು ಅನ್ವೇಷಿಸಿ
ಎಲ್ಲವನ್ನೂ ಬ್ರೌಸ್ ಮಾಡಿ →