ChartGo
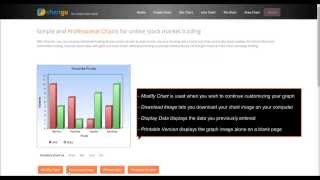
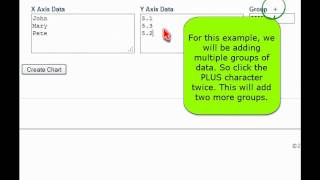
데이터 분석 및 시각화 소프트웨어This online tool facilitates the creation of various types of charts, including bar, line, pie, and area charts, allowing users to visualize data effectively and attractively. Features such as easy data import, extensive customization options, and no associated costs, it addresses the needs of data professionals, educators, and anyone seeking to present information clearly and engagingly.
ChartGo은 다음에서 찾을 수 있습니다. Data Analysis & Visualization Software 카테고리.
ChartGo과 가장 유사한 제품은 다음과 같습니다.
스크린샷
아직 업로드된 스크린샷이 없습니다. 이 사업체의 소유주이신가요?
스크린샷을 업로드하세요.유튜브 동영상
공식 유튜브 채널의 영상들
(12 videos)


세부
ChartGo 주요 특징
ChartGo 혜택
누가 ChartGo을 사용해야 하나요?
배지
당사 배지 중 하나로 SaaS 권한을 높이세요
ChartGo 대안
DashThis 홍보됨
DashThis is an automated marketing reporting tool designed to help users crea...
Terry-Donnelly Suite 홍보됨
DashThis is an automated marketing reporting tool designed to help users crea...
Graph Maker
A versatile online tool enables users to create a wide variety of charts and ...
ChartMaker
This browser-based charting platform converts data into professional visuals ...
Nderim
This tool enables users to effortlessly create visually appealing, hand-drawn...
Graph Plotter
인증된 프로필
A data visualization and graph plotting tool enables users to easily create a...
이 카테고리에서 더 많은 내용을 살펴보세요:
사용된 기술
* Google은 안전하지 않은 웹 리소스에 대한 정확하고 최신 정보를 제공하기 위해 노력하지만 완전성이나 오류 없는 결과를 보장할 수 없습니다.
** 이 페이지의 일부 또는 전체 내용은 AI에서 생성되었을 수 있으므로 중요한 정보는 독립적으로 확인하십시오.
최근 청구됨
시간 추적 및 생산성 소프트웨어
인증, 시험 및 평가 준비
시간 추적 및 생산성 소프트웨어
청구 및 지불 처리
건설 프로젝트 관리 도구
영양 및 다이어트 계획 SaaS
시뮬레이션 및 모델링 도구
웹 호스팅 관리 및 최적화
소셜 미디어 관리 및 일정
AI 기반 이력서 검토 도구
최근 추가됨
Xpantra
HRIS 및 핵심 HR 소프트웨어
Assemble
계약직 및 프리랜서 관리
DelayOFF
산업 자동화
Ayotta
학습 및 교육 플랫폼
XHS
AI 기반 법률 연구 플랫폼
Hypno Admin Pro
클리닉을 위한 환자 일정 관리 및 CRM
OpenClaw
Discord 및 Telegram 커뮤니티 도구
CodePit
AutoML 플랫폼
Stark Analytics
예측 분석 소프트웨어
Hisab Nikas
회계 소프트웨어
이달의 인기 카테고리 10선
1.
영업 자동화 소프트웨어
+856
지난 30일 동안 이 카테고리에 추가된 신규 SaaS 제품 수.
2.
블록체인 및 NFT 관리 플랫폼
+592
지난 30일 동안 이 카테고리에 추가된 신규 SaaS 제품 수.
3.
문서 관리 및 전자 서명 도구
+522
지난 30일 동안 이 카테고리에 추가된 신규 SaaS 제품 수.
4.
AI 기반 가상 아바타 및 디지털 비서
+497
지난 30일 동안 이 카테고리에 추가된 신규 SaaS 제품 수.
5.
클라우드 보안 및 규정 준수 도구
+493
지난 30일 동안 이 카테고리에 추가된 신규 SaaS 제품 수.
6.
AI 기반 이력서 검토 도구
+489
지난 30일 동안 이 카테고리에 추가된 신규 SaaS 제품 수.
7.
AI 기반 진단 및 의료 분석
+445
지난 30일 동안 이 카테고리에 추가된 신규 SaaS 제품 수.
8.
AI 기반 법률 연구 플랫폼
+433
지난 30일 동안 이 카테고리에 추가된 신규 SaaS 제품 수.
9.
학습 및 교육 플랫폼
+426
지난 30일 동안 이 카테고리에 추가된 신규 SaaS 제품 수.
10.
차량 관리 소프트웨어
+422
지난 30일 동안 이 카테고리에 추가된 신규 SaaS 제품 수.
SaaS 브라우저 통계
지난 30일 동안 추가됨
+21,811
지난 30일 동안 당사 데이터베이스에 새로 추가된 SaaS 제품의 수입니다.
액티브 SaaS
468,001
현재 당사 검색 엔진에 색인된 게시 및 활성화된 SaaS 제품의 총 개수입니다.
데이터베이스의 총계
1,296,182
데이터베이스에 등록된 모든 SaaS 제품의 총 개수이며, 여기에는 미등록 및 단종된 제품도 포함됩니다.
스폰서
Fish Audio
음성 복제 및 텍스트 음성 변환 SaaS
Content Harmony
콘텐츠 마케팅 플랫폼
Folderly
이메일 마케팅 소프트웨어
Ziggma
투자 포트폴리오 관리
ReciPal
영양 및 다이어트 계획 SaaS
Mailtrap
마케팅 자동화 플랫폼
Pulse
CRM(고객 관계 관리)
Smodin
AI 기반 글쓰기 및 카피 생성
ProxyCove
웹 스크래핑 API 및 프록시
GetSales
리드 생성 소프트웨어
놓치지 마세요, 누구보다 먼저 소식을 접하세요!
매일 새로운 SaaS 제품이 출시되고 있으며, 지난 30일 동안에만 21,811개의 제품이 추가되었습니다. SaaS Browser를 통해 검색어와 일치하는 새로운 SaaS 제품이 발견되면 가장 먼저 알림을 받으세요.
검색어와 일치하는 새로운 SaaS에 대한 이메일 알림을 설정하려면 로그인하세요.
로그인하여 알림 만들기
유사한 도구 살펴보기
모두 보기 →