Zweryfikuj i zaktualizuj profil
Zgłoszone profile pojawiają się na górze wyników wyszukiwania. Zweryfikuj już teraz – zajmie Ci to tylko kilka minut.
Odwiedzać
Raport
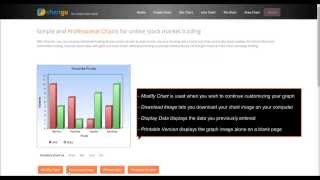
This online tool facilitates the creation of various types of charts, including bar, line, pie, and area charts, allowing users to visualize data effectively and attractively. Features such as easy data import, extensive customization options, and no associated costs, it addresses the needs of data professionals, educators, and anyone seeking to present information clearly and engagingly.
ChartGo można znaleźć w Data Analysis & Visualization Software kategorie.
Produkty najbardziej podobne do ChartGo to:
Zrzuty ekranu
Nie przesłano jeszcze żadnych zrzutów ekranu. Czy jesteś właścicielem tej firmy?
Prześlij zrzuty ekranu.Filmy na YouTube
Filmy z oficjalnego kanału YouTube
(12 videos)


Bliższe dane
Recenzje
–
0 recenzje
5
–
4
–
3
–
2
–
1
–
ChartGo Główne cechy
ChartGo Korzyści
Kto powinien używać ChartGo?
Odznaki
Zwiększ autorytet swojego SaaS dzięki jednemu z naszych odznak
Alternatywy ChartGo
DashThis Lansowany
DashThis is an automated marketing reporting tool designed to help users crea...
Graph Maker
A versatile online tool enables users to create a wide variety of charts and ...
ChartMaker
This browser-based charting platform converts data into professional visuals ...
Nderim
This tool enables users to effortlessly create visually appealing, hand-drawn...
Graph Plotter
Zweryfikowany profil
A data visualization and graph plotting tool enables users to easily create a...
Odkryj więcej w tej kategorii:
Zastosowane technologie
* Google dokłada wszelkich starań, aby dostarczać dokładne i aktualne informacje o niebezpiecznych zasobach internetowych, jednak nie może zagwarantować kompletności ani braku błędów w uzyskanych wynikach.
** Część lub całość tej strony może być wygenerowana przez sztuczną inteligencję, dlatego prosimy o niezależne sprawdzenie wszelkich istotnych informacji.
Ostatnio zgłoszone
Narzędzia do planowania finansowego i budżetowania
Narzędzia do chatbotów i marketingu konwersacyjnego
Business Intelligence i analityka
Oprogramowanie do ankiet i opinii klientów
Aplikacje do nauki języków oparte na sztucznej inteligencji
Oprogramowanie do prognozowania i planowania popytu
Aplikacje Shopify
Oprogramowanie do śledzenia czasu i produktywności
Narzędzia do przeszukiwania CV oparte na sztucznej inteligencji
Platformy marketingu treści
Ostatnio dodane
List Perfectly
Brokerzy i rynki
SalesCRM
Oprogramowanie do automatyzacji sprzedaży
Dopamyn
Platformy monetyzacji twórców
LeadBox
Oprogramowanie do generowania leadów
Autogrow
Oprogramowanie do precyzyjnego rolnictwa
Hisaab
Zarządzanie zapasami i magazynem
Spelly
Aplikacje do nauki języków oparte na sztucznej inteligencji
VEO3
Narzędzia do edycji wideo i animacji oparte na sztucznej inteligencji
Infloxy
Narzędzia do marketingu influencerskiego i zasięgu
Loopzit
Oprogramowanie do programów poleceń i lojalnościowych
10 najpopularniejszych kategorii w tym miesiącu
1.
Oprogramowanie do automatyzacji sprzedaży
+856
Liczba nowych produktów SaaS dodanych do tej kategorii w ciągu ostatnich 30 dni.
2.
Platformy zarządzania blockchainem i NFT
+592
Liczba nowych produktów SaaS dodanych do tej kategorii w ciągu ostatnich 30 dni.
3.
Narzędzia do zarządzania dokumentami i podpisów elektronicznych
+522
Liczba nowych produktów SaaS dodanych do tej kategorii w ciągu ostatnich 30 dni.
4.
Wirtualne awatary i asystenci cyfrowi z obsługą sztucznej inteligencji
+497
Liczba nowych produktów SaaS dodanych do tej kategorii w ciągu ostatnich 30 dni.
5.
Narzędzia do zapewniania bezpieczeństwa i zgodności w chmurze
+493
Liczba nowych produktów SaaS dodanych do tej kategorii w ciągu ostatnich 30 dni.
6.
Narzędzia do przeszukiwania CV oparte na sztucznej inteligencji
+489
Liczba nowych produktów SaaS dodanych do tej kategorii w ciągu ostatnich 30 dni.
7.
Diagnostyka i analiza opieki zdrowotnej oparta na sztucznej inteligencji
+445
Liczba nowych produktów SaaS dodanych do tej kategorii w ciągu ostatnich 30 dni.
8.
Platformy badań prawnych oparte na sztucznej inteligencji
+433
Liczba nowych produktów SaaS dodanych do tej kategorii w ciągu ostatnich 30 dni.
9.
Platformy edukacyjne i edukacyjne
+426
Liczba nowych produktów SaaS dodanych do tej kategorii w ciągu ostatnich 30 dni.
10.
Oprogramowanie do zarządzania flotą
+422
Liczba nowych produktów SaaS dodanych do tej kategorii w ciągu ostatnich 30 dni.
Statystyki przeglądarki SaaS
Dodano w ciągu ostatnich 30 dni
+21,811
Liczba nowych produktów SaaS odkrytych i dodanych do naszej bazy danych w ciągu ostatnich 30 dni.
Aktywne oprogramowanie jako usługa (SaaS)
468,001
Łączna liczba opublikowanych i aktywnych produktów SaaS aktualnie indeksowanych w naszej wyszukiwarce.
Razem w bazie danych
1,296,182
Całkowita liczba wszystkich produktów SaaS w naszej bazie danych, wliczając w to wpisy nieopublikowane i wycofane.
Dołącz do przeglądarki SaaS za darmo
Korzystaj ze wszystkich zaawansowanych filtrów za darmo
Zarządzaj swoimi ofertami SaaS
Twórz bezpłatne alerty dla nowych usług SaaS
Sponsorowane
Nuelink
Zarządzanie mediami społecznościowymi i planowanie
Collect.chat
Narzędzia do chatbotów i marketingu konwersacyjnego
Plaky
Oprogramowanie do zarządzania projektami
Offorte
Oprogramowanie do zarządzania projektami
LowFruits
Narzędzia SEO
Orvelle
Harmonogramowanie wizyt pacjentów i CRM dla klinik
TekMatix
Platformy automatyzacji marketingu
Buffer
Zarządzanie mediami społecznościowymi i planowanie
AnswerThis
Narzędzia akademickie
Startup For Startups
Platformy marketingu treści
Nie przegap, bądź pierwszy, który się dowie!
Nowe produkty SaaS pojawiają się każdego dnia – w ciągu ostatnich 30 dni dodano ich 21,811. Bądź na bieżąco i jako pierwszy dowiaduj się o nowych produktach SaaS odpowiadających Twojemu zapytaniu, które zostaną odkryte przez przeglądarkę SaaS.
Zaloguj się, aby ustawić powiadomienia e-mail dla nowych produktów SaaS pasujących do Twojego wyszukiwania.
Zaloguj się, aby utworzyć alert
Przeglądaj podobne narzędzia
Przeglądaj wszystko →