Få bekræftet og opdater profil
Profiler, der er gjort krav på, vises øverst i søgeresultaterne. Bliv bekræftet nu, det tager kun et par minutter.
Besøg
Rapport
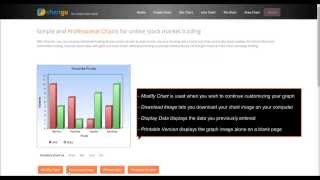
This online tool facilitates the creation of various types of charts, including bar, line, pie, and area charts, allowing users to visualize data effectively and attractively. Features such as easy data import, extensive customization options, and no associated costs, it addresses the needs of data professionals, educators, and anyone seeking to present information clearly and engagingly.
ChartGo kan findes i Data Analysis & Visualization Software kategorier.
De produkter, der ligner ChartGo mest, er:
Skærmbilleder
Der er endnu ikke uploadet nogen skærmbilleder. Ejer du denne virksomhed?
Upload skærmbilleder.YouTube-videoer
Videoer fra den officielle YouTube-kanal
(12 videos)


Detaljer
ChartGo Hovedfunktioner
ChartGo fordele
Hvem bør bruge ChartGo?
Badges
Øg din SaaS-autoritet med et af vores badges
ChartGo Alternativer
DashThis Forfremmet
DashThis is an automated marketing reporting tool designed to help users crea...
Graph Maker
A versatile online tool enables users to create a wide variety of charts and ...
ChartMaker
This browser-based charting platform converts data into professional visuals ...
Nderim
This tool enables users to effortlessly create visually appealing, hand-drawn...
Graph Plotter
Verificeret profil
A data visualization and graph plotting tool enables users to easily create a...
Udforsk mere i denne kategori:
Anvendte teknologier
* Google bestræber sig på at levere nøjagtige og opdaterede oplysninger om usikre webressourcer, men kan ikke garantere fuldstændighed eller fejlfri resultater.
** Nogle eller alle dele af denne side kan være genereret af kunstig intelligens, så verificér venligst alle kritiske oplysninger uafhængigt.
Nyligt gjort krav på
Abonnementsfakturering og tilbagevendende betalinger
WooCommerce-plugins og -udvidelser
Hjemmesideovervågning, oppetid og ydeevne
Influencer Marketing & Outreach-værktøjer
Telemedicin- og virtuelle konsultationsplatforme
Administration og planlægning af sociale medier
Administration og planlægning af sociale medier
Aktiehandels- og mæglerplatforme
Lønstyringssoftware
Ernærings- og kostplanlægning SaaS
Nyligt tilføjet
Escalona
Workflowautomatisering og RPA
Eazy Cutz
Software til aftaleplanlægning
Aicoo
Værktøjer til fjernteamsamarbejde
Life Manager Pro
Opgavestyring og to-do-liste-apps
Epique
CRM og leadhåndtering i fast ejendom
Sentinel
Software til håndtering af leasing
Symba Global
Software til realkreditlån og lån
LeadBox
Leadgenereringssoftware
SHARP
Energistyringssoftware
Vento Orange
Skoleadministrationssoftware
Top 10 kategorier denne måned
1.
Salgsautomatiseringssoftware
+856
Antal nye SaaS-produkter tilføjet til denne kategori i de seneste 30 dage.
2.
Blockchain- og NFT-administrationsplatforme
+592
Antal nye SaaS-produkter tilføjet til denne kategori i de seneste 30 dage.
3.
Dokumenthåndtering og e-signaturværktøjer
+522
Antal nye SaaS-produkter tilføjet til denne kategori i de seneste 30 dage.
4.
AI-drevne virtuelle avatarer og digitale assistenter
+497
Antal nye SaaS-produkter tilføjet til denne kategori i de seneste 30 dage.
5.
Værktøjer til cloudsikkerhed og compliance
+493
Antal nye SaaS-produkter tilføjet til denne kategori i de seneste 30 dage.
6.
AI-drevne CV-screeningsværktøjer
+489
Antal nye SaaS-produkter tilføjet til denne kategori i de seneste 30 dage.
7.
AI-drevet diagnose og sundhedsanalyse
+445
Antal nye SaaS-produkter tilføjet til denne kategori i de seneste 30 dage.
8.
AI-drevne juridiske forskningsplatforme
+433
Antal nye SaaS-produkter tilføjet til denne kategori i de seneste 30 dage.
9.
Lærings- og uddannelsesplatforme
+426
Antal nye SaaS-produkter tilføjet til denne kategori i de seneste 30 dage.
10.
Flådestyringssoftware
+422
Antal nye SaaS-produkter tilføjet til denne kategori i de seneste 30 dage.
SaaS-browserstatistik
Tilføjet de seneste 30 dage
+21,811
Antal nye SaaS-produkter opdaget og tilføjet til vores database i de sidste 30 dage.
Aktiv SaaS
468,001
Samlet antal publicerede og aktive SaaS-produkter, der i øjeblikket er indekseret i vores søgemaskine.
Total i databasen
1,296,182
Samlet antal af alle SaaS-produkter i vores database, inklusive ikke-publicerede og udgåede poster.
Tilmeld dig SaaS Browser gratis
Brug alle avancerede filtre gratis
Administrer dine SaaS-lister
Opret gratis alarmer til nye SaaS-løsninger
Sponsoreret
Nuelink
Administration og planlægning af sociale medier
Flowlu
Projektstyringssoftware
StoryChief
Indholdsmarkedsføringsplatforme
Accessibly
Hjemmesidebyggere
Collect.chat
Chatbot- og samtalemarkedsføringsværktøjer
DivParser
Webscraping API og proxyer
StreamYard
Streaming- og live-udsendelsesplatforme
Snaptually
AI-drevne virtuelle avatarer og digitale assistenter
Clockify
Tidsregistrering og produktivitetssoftware
Diginius
Marketingautomatiseringsplatforme
Gå ikke glip af det, vær den første til at vide det!
Nye SaaS-produkter lanceres hver dag, 21,811 er blevet tilføjet alene i de sidste 30 dage. Hold dig informeret, og vær den første til at vide, når SaaS Browser opdager nye SaaS-produkter, der matcher din søgeforespørgsel.
Log ind for at opsætte e-mailalarmer for nye SaaS, der matcher din søgning.
Log ind for at oprette alarm
Udforsk lignende værktøjer
Gennemse alle →