Lassen Sie sich verifizieren und aktualisieren Sie Ihr Profil
Beanspruchte Profile erscheinen ganz oben in den Suchergebnissen. Lassen Sie sich jetzt verifizieren, es dauert nur ein paar Minuten.
Besuchen
Bericht
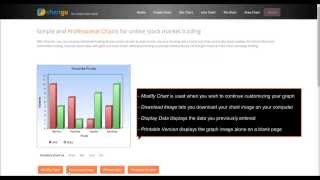
This online tool facilitates the creation of various types of charts, including bar, line, pie, and area charts, allowing users to visualize data effectively and attractively. Features such as easy data import, extensive customization options, and no associated costs, it addresses the needs of data professionals, educators, and anyone seeking to present information clearly and engagingly.
ChartGo kann gefunden werden in Data Analysis & Visualization Software Kategorien.
Die Produkte, die ChartGo am ähnlichsten sind, sind:
Screenshots
Es wurden noch keine Screenshots hochgeladen. Gehört Ihnen dieses Unternehmen?
Laden Sie Screenshots hoch.YouTube-Videos
Videos vom offiziellen YouTube-Kanal
(12 videos)


Details
Rezensionen
–
0 Rezensionen
5
–
4
–
3
–
2
–
1
–
ChartGo Hauptfunktionen
ChartGo Vorteile
Wer sollte ChartGo verwenden?
Abzeichen
Steigern Sie Ihre SaaS-Autorität mit einem unserer Abzeichen
ChartGo-Alternativen
DashThis Befördert
DashThis is an automated marketing reporting tool designed to help users crea...
Graph Maker
A versatile online tool enables users to create a wide variety of charts and ...
ChartMaker
This browser-based charting platform converts data into professional visuals ...
Nderim
This tool enables users to effortlessly create visually appealing, hand-drawn...
Graph Plotter
Verifiziertes Profil
A data visualization and graph plotting tool enables users to easily create a...
Entdecken Sie mehr in dieser Kategorie:
Verwendete Technologien
* Google ist bestrebt, genaue und aktuelle Informationen zu unsicheren Webressourcen bereitzustellen, kann jedoch keine Vollständigkeit oder fehlerfreie Ergebnisse garantieren.
** Einige oder alle Teile dieser Seite können mithilfe von KI generiert sein. Überprüfen Sie daher alle wichtigen Informationen bitte unabhängig.
Kürzlich beansprucht
Cloud-Sicherheits- und Compliance-Tools
Dokumentenmanagement- und eSignatur-Tools
Vertriebsautomatisierungssoftware
API- und Backend-as-a-Service-Plattformen
Schwachstellenanalyse und Penetrationstests
Cloud-Sicherheits- und Compliance-Tools
Lern- und Bildungsplattformen
Projektmanagement-Software
Business Intelligence und Analytik
KI-gestützte Transkription und Untertitelgenerierung
Kürzlich hinzugefügt
Refinery
WooCommerce-Plugins und -Erweiterungen
Inpromptify
KI-gestützte Tools zur Lebenslaufprüfung
TechDeck
Projektmanagement-Software
PhiFix
Compliance-Management-Software
CarHill Medical
Patiententerminplanung & CRM für Kliniken
SoterraOne
Cloud-Sicherheits- und Compliance-Tools
CondoQualifier
Hausverwaltung und Verwaltung von Wohneigentümergemeinschaften
Payouts
Kreditorenbuchhaltung & Ausgabenmanagement
VenXware
Lager- und Bestandsverwaltung
Hisabi
Bestands- und Lagerverwaltung
Top 10 Kategorien diesen Monat
1.
Vertriebsautomatisierungssoftware
+856
Anzahl der in den letzten 30 Tagen in diese Kategorie hinzugefügten neuen SaaS-Produkte.
2.
Blockchain- und NFT-Verwaltungsplattformen
+592
Anzahl der in den letzten 30 Tagen in diese Kategorie hinzugefügten neuen SaaS-Produkte.
3.
Dokumentenmanagement- und eSignatur-Tools
+522
Anzahl der in den letzten 30 Tagen in diese Kategorie hinzugefügten neuen SaaS-Produkte.
4.
KI-gestützte virtuelle Avatare und digitale Assistenten
+497
Anzahl der in den letzten 30 Tagen in diese Kategorie hinzugefügten neuen SaaS-Produkte.
5.
Cloud-Sicherheits- und Compliance-Tools
+493
Anzahl der in den letzten 30 Tagen in diese Kategorie hinzugefügten neuen SaaS-Produkte.
6.
KI-gestützte Tools zur Lebenslaufprüfung
+489
Anzahl der in den letzten 30 Tagen in diese Kategorie hinzugefügten neuen SaaS-Produkte.
7.
KI-gestützte Diagnose und Gesundheitsanalyse
+445
Anzahl der in den letzten 30 Tagen in diese Kategorie hinzugefügten neuen SaaS-Produkte.
8.
KI-gestützte Plattformen für Rechtsrecherche
+433
Anzahl der in den letzten 30 Tagen in diese Kategorie hinzugefügten neuen SaaS-Produkte.
9.
Lern- und Bildungsplattformen
+426
Anzahl der in den letzten 30 Tagen in diese Kategorie hinzugefügten neuen SaaS-Produkte.
10.
Flottenmanagement-Software
+422
Anzahl der in den letzten 30 Tagen in diese Kategorie hinzugefügten neuen SaaS-Produkte.
SaaS-Browserstatistiken
Hinzugefügt in den letzten 30 Tagen
+21,811
Anzahl der neuen SaaS-Produkte, die in den letzten 30 Tagen entdeckt und unserer Datenbank hinzugefügt wurden.
Aktive SaaS
468,001
Gesamtzahl der veröffentlichten und aktiven SaaS-Produkte, die derzeit in unserer Suchmaschine indexiert sind.
Gesamt in der Datenbank
1,296,182
Gesamtzahl aller SaaS-Produkte in unserer Datenbank, einschließlich unveröffentlichter und eingestellter Einträge.
Jetzt kostenlos bei SaaS Browser anmelden
Nutzen Sie alle erweiterten Filter kostenlos
Verwalten Sie Ihre SaaS-Einträge
Erstellen Sie kostenlose Benachrichtigungen für neue SaaS-Lösungen.
Gesponsert
Crocoblock
WordPress-Plugins
Bookly
Terminplanungssoftware
Harpoon
Tools für Finanzplanung und Budgetierung
Kure
Projektmanagement-Software
Replug
Content-Marketing-Plattformen
WalletCalcs
Tools für Finanzplanung und Budgetierung
Unicorn Platform
Website-Builder
Keyword.com
Business Intelligence und Analytik
SimpleBackups
Cloud-Speicher, Backup und Dateifreigabe
SendX
E-Mail-Marketing-Software
Verpassen Sie nichts, erfahren Sie es als Erster!
Täglich kommen neue SaaS-Produkte auf den Markt, allein in den letzten 30 Tagen kamen 21,811 hinzu. Bleiben Sie informiert und erfahren Sie als Erster, wenn der SaaS-Browser neue SaaS-Produkte entdeckt, die Ihrer Suchanfrage entsprechen.
Melden Sie sich an, um E-Mail-Benachrichtigungen für neue SaaS einzurichten, die Ihrer Suche entsprechen.
Anmelden um Benachrichtigung zu erstellen
Entdecken Sie ähnliche Tools
Alle anzeigen →