ChartGo
תוכנת ניתוח והדמיה של נתונים
קבל אימות ועדכן פרופיל
פרופילים שתבעו זכויות יוצרים מופיעים בראש תוצאות החיפוש. קבלו אימות עכשיו, זה לוקח רק כמה דקות.
לְבַקֵר
דִוּוּחַ
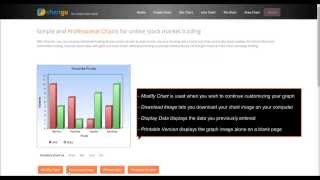
This online tool facilitates the creation of various types of charts, including bar, line, pie, and area charts, allowing users to visualize data effectively and attractively. Features such as easy data import, extensive customization options, and no associated costs, it addresses the needs of data professionals, educators, and anyone seeking to present information clearly and engagingly.
ניתן למצוא את ChartGo ב Data Analysis & Visualization Software קטגוריות.
המוצרים הדומים ביותר ל-ChartGo הם:
צילומי מסך
עדיין לא הועלו צילומי מסך. האם אתה הבעלים של העסק הזה?
העלה צילומי מסך.סרטוני יוטיוב
סרטונים מערוץ היוטיוב הרשמי
(12 videos)


פרטים
תכונות עיקריות של ChartGo
ChartGo יתרונות
למי כדאי להשתמש ב-ChartGo?
תגים
הגבר את סמכות ה-SaaS שלך עם אחד מהתגים שלנו
אלטרנטיבות ל-ChartGo
DashThis מקודם
DashThis is an automated marketing reporting tool designed to help users crea...
Graph Maker
A versatile online tool enables users to create a wide variety of charts and ...
ChartMaker
This browser-based charting platform converts data into professional visuals ...
Nderim
This tool enables users to effortlessly create visually appealing, hand-drawn...
Graph Plotter
פרופיל מאומת
A data visualization and graph plotting tool enables users to easily create a...
גלו עוד בקטגוריה זו:
טכנולוגיות בשימוש
* גוגל שואפת לספק מידע מדויק ועדכני על משאבי אינטרנט לא בטוחים, אך אינה יכולה להבטיח שלמות או תוצאות נקיות משגיאות.
** ייתכן שחלק או כל חלקי דף זה נוצרו על ידי בינה מלאכותית, לכן אנא אמת כל מידע קריטי באופן עצמאי.
תבע לאחרונה
פלטפורמת מודיעין קולקטיבי
פלטפורמות מסחר ותיווך במניות
כלים אקדמיים
ניהול ותזמון מדיה חברתית
תוכנת משוב וסקרי לקוחות
תוכנת מעקב זמן ופרודוקטיביות
כתיבה והעתקה מבוססות בינה מלאכותית
תוכנת ניתוח והדמיה של נתונים
בינה עסקית ואנליטיקה
כלי קידום אתרים (SEO)
נוסף לאחרונה
EazyCart
ברוקרים ופלטפורמות מסחר
VideoFlowEngine
אירוח וניהול וידאו
CareerDash
כלי סינון קורות חיים המופעלים על ידי בינה מלאכותית
HypeMatch
פלטפורמות מסחר ותיווך במניות
OctaneOS
כלי ניהול פרויקטים בבנייה
Percuity
קריאייטיב פרסומי ויצירת סרטונים המונעים על ידי בינה מלאכותית
Sports Management
פלטפורמות ניהול אירועים וכרטוס
Ekklesiasys
תוכנה לניהול כנסיות
Showup
מעקב אחר בריאות וכושר
Sales Dashboard CRM
פלטפורמות מעורבות מכירות
10 הקטגוריות המובילות החודש
1.
תוכנת אוטומציה של מכירות
+856
מספר מוצרי SaaS חדשים שנוספו לקטגוריה זו ב-30 הימים האחרונים.
2.
פלטפורמות ניהול בלוקצ'יין ו-NFT
+592
מספר מוצרי SaaS חדשים שנוספו לקטגוריה זו ב-30 הימים האחרונים.
3.
כלי ניהול מסמכים וחתימה אלקטרונית
+522
מספר מוצרי SaaS חדשים שנוספו לקטגוריה זו ב-30 הימים האחרונים.
4.
אווטארים וירטואליים ועוזרים דיגיטליים המופעלים על ידי בינה מלאכותית
+497
מספר מוצרי SaaS חדשים שנוספו לקטגוריה זו ב-30 הימים האחרונים.
5.
כלי אבטחה ותאימות בענן
+493
מספר מוצרי SaaS חדשים שנוספו לקטגוריה זו ב-30 הימים האחרונים.
6.
כלי סינון קורות חיים המופעלים על ידי בינה מלאכותית
+489
מספר מוצרי SaaS חדשים שנוספו לקטגוריה זו ב-30 הימים האחרונים.
7.
אבחון ואנליטיקה רפואית מבוססי בינה מלאכותית
+445
מספר מוצרי SaaS חדשים שנוספו לקטגוריה זו ב-30 הימים האחרונים.
8.
פלטפורמות מחקר משפטיות המונעות על ידי בינה מלאכותית
+433
מספר מוצרי SaaS חדשים שנוספו לקטגוריה זו ב-30 הימים האחרונים.
9.
פלטפורמות למידה וחינוך
+426
מספר מוצרי SaaS חדשים שנוספו לקטגוריה זו ב-30 הימים האחרונים.
10.
תוכנת ניהול צי
+422
מספר מוצרי SaaS חדשים שנוספו לקטגוריה זו ב-30 הימים האחרונים.
סטטיסטיקות דפדפן SaaS
נוסף ב-30 הימים האחרונים
+21,811
מספר מוצרי SaaS חדשים שהתגלו ונוספו למסד הנתונים שלנו ב-30 הימים האחרונים.
SaaS פעיל
468,001
המספר הכולל של מוצרי SaaS שפורסמו ופעילים המאונדקסים כעת במנוע החיפוש שלנו.
סה"כ במסד הנתונים
1,296,182
המספר הכולל של כל מוצרי ה-SaaS במסד הנתונים שלנו, כולל רשומות שלא פורסמו ורשומות שהופסקו.
הצטרף לדפדפן SaaS בחינם
השתמשו בכל המסננים המתקדמים בחינם
ניהול רישומי SaaS שלך
צור התראות בחינם עבור SaaS חדש
ממומן
Usermaven
מפות חום של אתרים וניתוח חוויית משתמש
GlockApps
תוכנת שיווק בדוא"ל
LaunchCut
בדיקות A/B ו-CRO
LeadCapture
תוכנה ליצירת לידים
Sniply
כלי שיווק ב-SMS וב-WhatsApp
Contractor Foreman
כלי ניהול פרויקטים בבנייה
Fraud Blocker
חסימת פרסומות ופרטיות
ReciPal
תזונה ותכנון דיאטה כשירות כשירות
Receipt Bot
עיבוד מסמכים המופעל על ידי בינה מלאכותית
Rankability
קופירייטינג ויצירת תוכן בבינה מלאכותית
אל תפספסו, היו הראשונים לדעת!
מוצרי SaaS חדשים מושקים מדי יום, 21,811 נוספו רק ב-30 הימים האחרונים. הישארו מעודכנים, והיו הראשונים לדעת מתי דפדפן SaaS מתגלה מוצרי SaaS חדשים התואמים את שאילתת החיפוש שלכם.
התחבר כדי להגדיר התראות דוא"ל עבור SaaS חדש המתאים לחיפוש שלך.
התחבר כדי ליצור התראה
גלה כלים דומים
עיין בכל →