ChartGo
ڈیٹا تجزیہ اور تصور سافٹ ویئر
تصدیق شدہ اور اپ ڈیٹ پروفائل حاصل کریں۔
دعوی کردہ پروفائلز تلاش کے نتائج کے اوپر جاتے ہیں۔ ابھی توثیق کریں، اس میں صرف چند منٹ لگتے ہیں۔
وزٹ کریں۔
رپورٹ
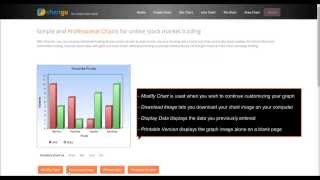
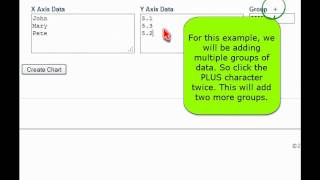
This online tool facilitates the creation of various types of charts, including bar, line, pie, and area charts, allowing users to visualize data effectively and attractively. Features such as easy data import, extensive customization options, and no associated costs, it addresses the needs of data professionals, educators, and anyone seeking to present information clearly and engagingly.
ChartGo میں پایا جا سکتا ہے۔ Data Analysis & Visualization Software زمرے
ChartGo سے ملتی جلتی مصنوعات ہیں:
اسکرین شاٹس
ابھی تک کوئی اسکرین شاٹس اپ لوڈ نہیں کیے گئے ہیں۔ کیا آپ اس کاروبار کے مالک ہیں؟
اسکرین شاٹس اپ لوڈ کریں۔یوٹیوب ویڈیوز
آفیشل یوٹیوب چینل سے ویڈیوز
(12 videos)


تفصیلات
ChartGo اہم خصوصیات
ChartGo فوائد
کس کو ChartGo استعمال کرنا چاہئے؟
بیجز
ہمارے بیجز میں سے ایک کے ساتھ اپنی SaaS اتھارٹی میں اضافہ کریں۔
ChartGo متبادل
DashThis ترقی دی گئی۔
DashThis is an automated marketing reporting tool designed to help users crea...
Graph Maker
A versatile online tool enables users to create a wide variety of charts and ...
ChartMaker
This browser-based charting platform converts data into professional visuals ...
Nderim
This tool enables users to effortlessly create visually appealing, hand-drawn...
Graph Plotter
تصدیق شدہ پروفائل
A data visualization and graph plotting tool enables users to easily create a...
اس زمرے میں مزید دریافت کریں۔:
استعمال شدہ ٹیکنالوجیز
* Google غیر محفوظ ویب وسائل کے بارے میں درست، تازہ ترین معلومات فراہم کرنے کی کوشش کرتا ہے لیکن مکمل یا غلطی سے پاک نتائج کی ضمانت نہیں دے سکتا۔
** اس صفحہ کے کچھ یا تمام حصے AI سے تیار کیے جا سکتے ہیں، لہذا براہ کرم کسی بھی اہم معلومات کی آزادانہ طور پر تصدیق کریں۔
حال ہی میں دعویٰ کیا گیا۔
ایس ایم ایس اور واٹس ایپ مارکیٹنگ ٹولز
کاپی رائٹنگ اور AI مواد کی تخلیق
ڈیجیٹل نوٹ لینے والی ایپس
مالیاتی منصوبہ بندی اور بجٹ سازی کے اوزار
انوائسنگ اور ادائیگی کی کارروائی
کوالٹی مینجمنٹ سسٹمز (QMS)
CRM (کسٹمر ریلیشن شپ مینجمنٹ)
چیٹ بوٹ اور بات چیت کے مارکیٹنگ ٹولز
آڈیو اور موسیقی
سیلز آٹومیشن سافٹ ویئر
حال ہی میں شامل کیا گیا۔
VEP
ورک فلو آٹومیشن اور آر پی اے
HypHosting
کھیل سرور ہوسٹنگ
Squawk
اے آئی کوڈ اسسٹنٹ اور کوپائلٹس
Fortwana
AI سے چلنے والی دستاویز کی پروسیسنگ
Oncoscope
AI سے چلنے والی تشخیص اور صحت کی دیکھ بھال کے تجزیات
MonyVault
ڈیجیٹل اثاثہ جات کا انتظام (DAM)
PreCheck Auto
بیک گراؤنڈ چیک سافٹ ویئر
AalapAI
چیٹ بوٹ اور بات چیت کے مارکیٹنگ ٹولز
Alerta
اندرونی مواصلاتی سافٹ ویئر
FinanceCalcAI
مالیاتی منصوبہ بندی اور بجٹ سازی کے اوزار
اس مہینے کی ٹاپ 10 کیٹیگریز
1.
سیلز آٹومیشن سافٹ ویئر
+856
پچھلے 30 دنوں میں اس زمرے میں شامل کیے گئے نئے SaaS پروڈکٹس کی تعداد۔
2.
بلاکچین اور این ایف ٹی مینجمنٹ پلیٹ فارمز
+592
پچھلے 30 دنوں میں اس زمرے میں شامل کیے گئے نئے SaaS پروڈکٹس کی تعداد۔
3.
دستاویز کا انتظام اور ای دستخطی ٹولز
+522
پچھلے 30 دنوں میں اس زمرے میں شامل کیے گئے نئے SaaS پروڈکٹس کی تعداد۔
4.
AI سے چلنے والے ورچوئل اوتار اور ڈیجیٹل اسسٹنٹ
+497
پچھلے 30 دنوں میں اس زمرے میں شامل کیے گئے نئے SaaS پروڈکٹس کی تعداد۔
5.
کلاؤڈ سیکیورٹی اور تعمیل کے ٹولز
+493
پچھلے 30 دنوں میں اس زمرے میں شامل کیے گئے نئے SaaS پروڈکٹس کی تعداد۔
6.
AI سے چلنے والے ریزیوم اسکریننگ ٹولز
+489
پچھلے 30 دنوں میں اس زمرے میں شامل کیے گئے نئے SaaS پروڈکٹس کی تعداد۔
7.
AI سے چلنے والی تشخیص اور صحت کی دیکھ بھال کے تجزیات
+445
پچھلے 30 دنوں میں اس زمرے میں شامل کیے گئے نئے SaaS پروڈکٹس کی تعداد۔
8.
AI سے چلنے والے قانونی تحقیقی پلیٹ فارمز
+433
پچھلے 30 دنوں میں اس زمرے میں شامل کیے گئے نئے SaaS پروڈکٹس کی تعداد۔
9.
سیکھنے اور تعلیم کے پلیٹ فارم
+426
پچھلے 30 دنوں میں اس زمرے میں شامل کیے گئے نئے SaaS پروڈکٹس کی تعداد۔
10.
فلیٹ مینجمنٹ سافٹ ویئر
+422
پچھلے 30 دنوں میں اس زمرے میں شامل کیے گئے نئے SaaS پروڈکٹس کی تعداد۔
SaaS براؤزر کے اعدادوشمار
پچھلے 30 دنوں میں شامل کیا گیا۔
+21,811
پچھلے 30 دنوں میں ہمارے ڈیٹا بیس میں دریافت اور شامل کیے گئے نئے SaaS پروڈکٹس کی تعداد۔
ایکٹو ساس
468,001
شائع شدہ اور فعال SaaS مصنوعات کی کل تعداد جو فی الحال ہمارے سرچ انجن میں ترتیب دی گئی ہے۔
ڈیٹا بیس میں کل
1,296,182
ہمارے ڈیٹا بیس میں SaaS پروڈکٹس کی کل تعداد، بشمول غیر مطبوعہ اور بند شدہ اندراجات۔
مفت میں SaaS براؤزر میں شامل ہوں۔
تمام جدید فلٹرز مفت میں استعمال کریں۔
اپنی SaaS فہرستوں کا نظم کریں۔
نئے SaaS کے لیے مفت الرٹس بنائیں
سپانسر شدہ
Bookly
اپوائنٹمنٹ شیڈولنگ سافٹ ویئر
Crocoblock
ورڈپریس پلگ انز
DashThis
ڈیٹا تجزیہ اور تصور سافٹ ویئر
LaunchCut
A/B ٹیسٹنگ اور CRO
AnswerThis
تحقیق اور حوالہ جات کا انتظام
REsimpli
ریئل اسٹیٹ سی آر ایم اور لیڈ مینجمنٹ
CallHippo
چیٹ بوٹ اور بات چیت کے مارکیٹنگ ٹولز
OneStream Live
سٹریمنگ اور لائیو براڈکاسٹ پلیٹ فارمز
Cloud Campaign
سوشل میڈیا مینجمنٹ اور شیڈولنگ
Replug
مواد کی مارکیٹنگ کے پلیٹ فارمز
مت چھوڑیں، جاننے والے پہلے بنیں!
نئی SaaS پروڈکٹس ہر روز لانچ ہو رہی ہیں، صرف پچھلے 30 دنوں میں 21,811 کو شامل کیا گیا۔ باخبر رہیں، اور یہ جاننے والے پہلے فرد بنیں کہ SaaS براؤزر کے ذریعہ آپ کی تلاش کے استفسار سے مماثل نیا SaaS کب دریافت ہوتا ہے۔
اپنی تلاش سے ملنے والے نئے SaaS کے لیے ای میل الرٹ ترتیب دینے کے لیے سائن ان کریں۔
الرٹ بنانے کے لیے سائن ان کریں
ملتے جلتے ٹولز کو دریافت کریں۔
سب کو براؤز کریں۔ →